U.S. Climate Vulnerability Index and Prevalence of Coronary Heart Disease and Stroke
Abstract
Introduction: Few studies have examined the relation between climate vulnerability with coronary heart disease (CHD) and stroke in the US using small area estimation methods. Such work is needed to identify high risk counties for targeted intervention. The U.S. Climate Vulnerability Index (CVI) is a novel composite measure of 184 indicators representing county-level vulnerability to climate risks. We sought to determine county-level associations between the CVI and CHD and stroke, hypothesizing that greater CVI would be associated with increased CHD and stroke prevalence.
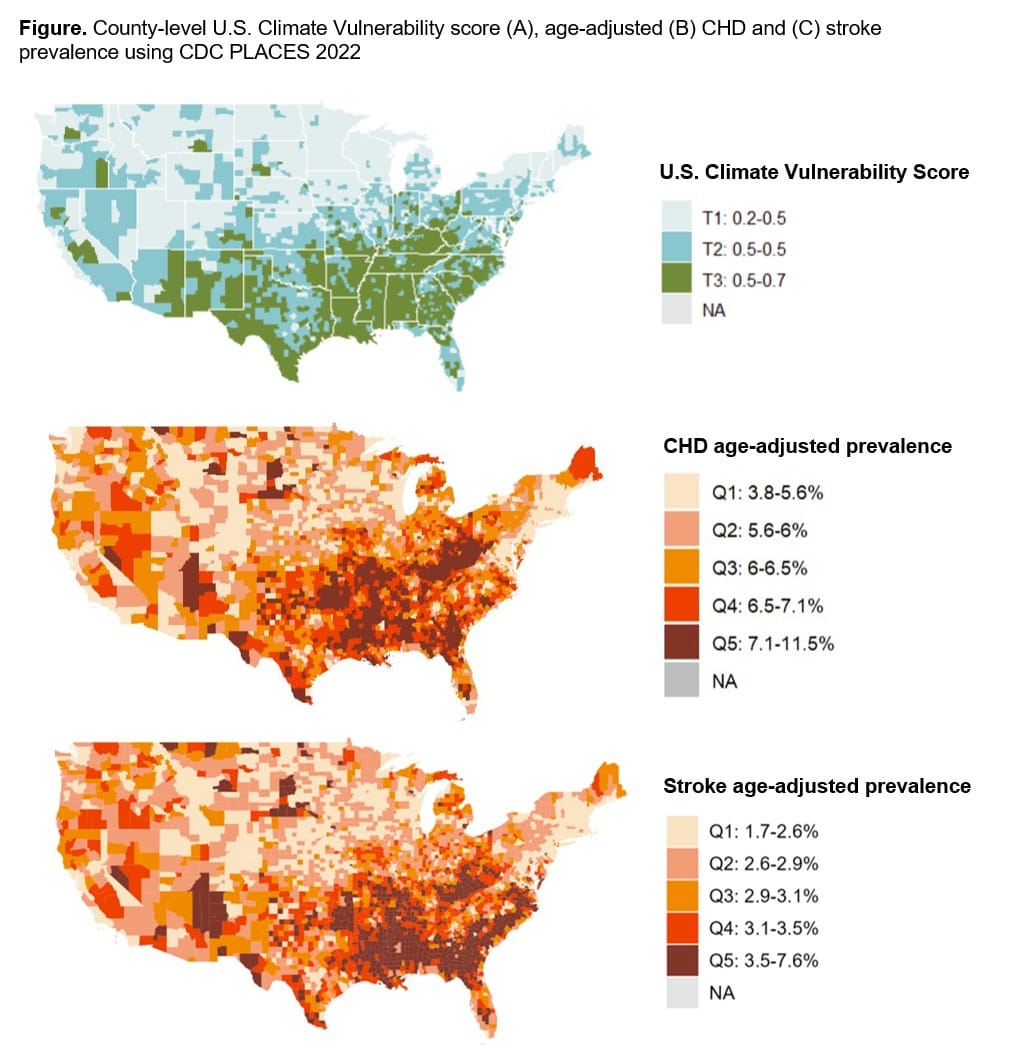
Methods: Using 2022 CDC Population Level Analysis and Community Estimates data, we conducted geospatial descriptive (Figure) and spatial lag models to estimate associations between county-level CVI (range: 0-1) (2017-2019) and CHD and stroke prevalence, separately. CVI exposure was categorized into tertiles (T1-T3). We used spatial lag regression models to estimate age-adjusted CHD and stroke prevalence and 95% confidence intervals (CI).
Results: Among 3,107 U.S. counties, age-adjusted CHD and stroke prevalence exhibited strong spatial clustering in the Southeastern region. High climate vulnerability tended to cluster in the Southeastern and Southwestern U.S. In spatial lag models accounting for county-level spatial dependence, we observed a 0.83% increase (95% CI: 0.78-0.90) in CHD prevalence, and a 0.61% increase (0.57-0.65) in stroke prevalence (T3 versus T1).
Conclusions: Counties with greater climate vulnerability appear associated with increased age-adjusted CHD and stroke burden, suggesting that communities facing elevated climate risks—particularly in the Southern U.S.—may experience disproportionate cardiovascular impacts. Our small area-level approach can identify counties for targeted support.