Residential street-view greenspace and cognitive decline in older adults in the Multi-Ethnic Study of Atherosclerosis (MESA)
Abstract
Background: Greenspace may protect against cognitive decline but it remains unclear if specific greenspace features drive protective associations. Street view (SV) based metrics (available since 2007), provide high resolution data on specific greenspace features (e.g. trees and grass) that may shed light on potential interventions. We aimed to assess associations between specific SV-based greenspace metrics and cognitive decline.
Methods: We used data from 4,160 participants enrolled in MESA 2000-02 (ages 45-84) with repeated global cognition composite (GCC) z-scores combining Cognitive Abilities Screening Instrument, Digit Symbol Coding, and Digit Span administered during follow-up exams 2010-12, 2016-18, and 2022-24. We linked participant addresses 2000-2020 with SV data within 500m. Addresses from 2000-2006 were assigned 2007 SV values. We conducted a quantitative bias analysis (QBA) to estimate direction and magnitude of potential mismeasurement error in 2000-2006 SV values using known satellite-based Normalized Difference Vegetation Index (NDVI). We then estimated fixed effects of cumulative average of %Trees and %Grass (uncorrected and QBA-corrected, separately) on baseline GCC and annual rate of GCC decline.
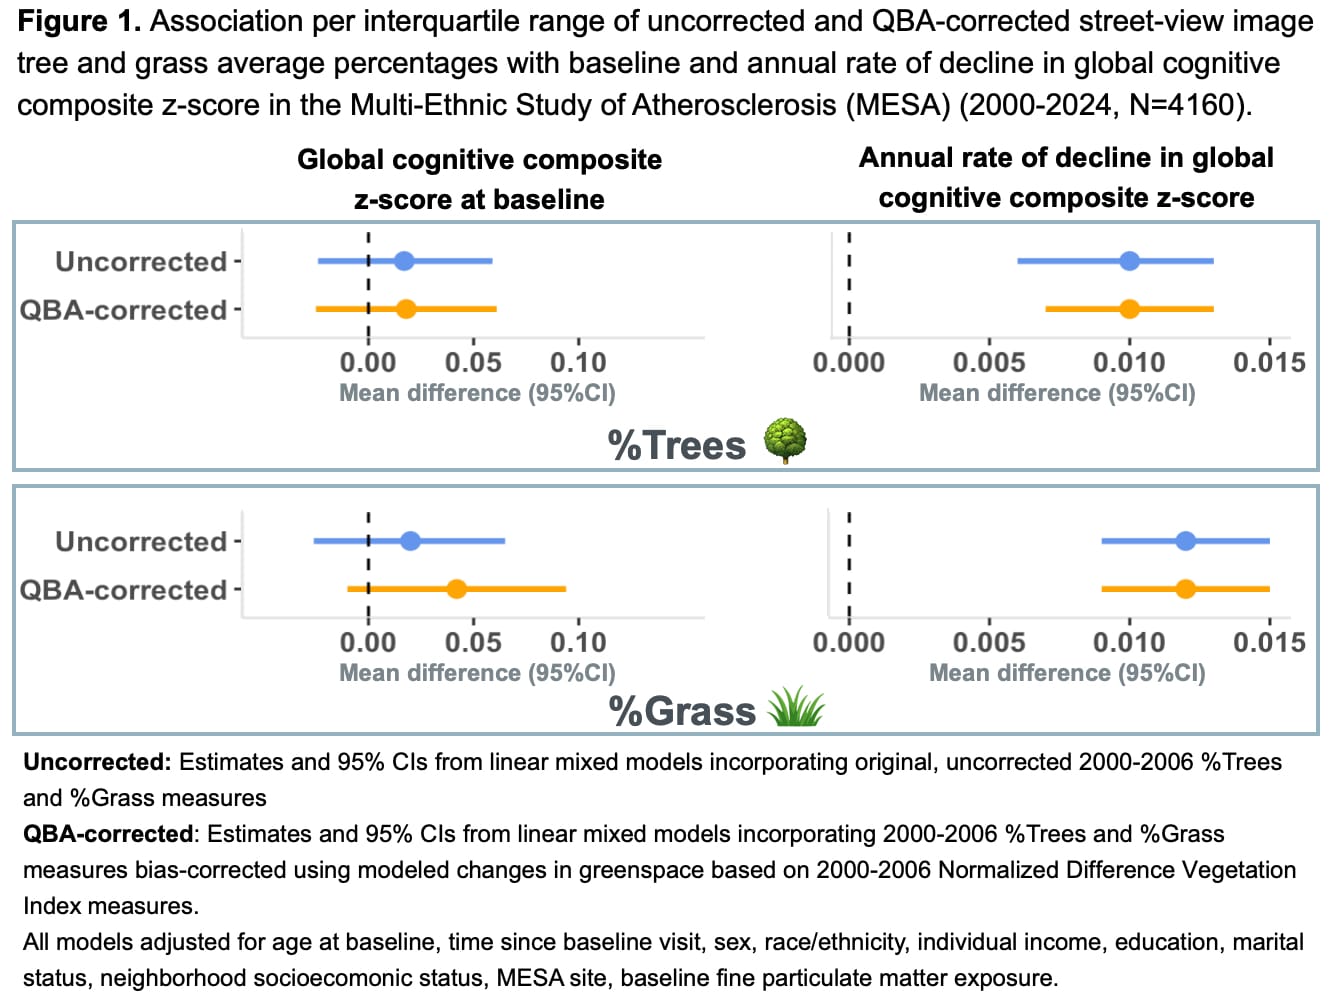
Results: Results are shown in Figure 1. Neither %Trees nor %Grass were associated with baseline GCC, for either uncorrected (mean difference z-score, %Trees 0.017 [-0.024, 0.059]; %Grass 0.020 [-0.026, 0.065]) or QBA-corrected measures (%Trees 0.018 [-0.025, 0.061]; %Grass 0.042 [-0.01, 0.094]). %Trees and %Grass were associated with slower annual rate of decline in GCC for both uncorrected (annual mean difference in z-score decline, %Trees: 0.010 [0.006, 0.013]; %Grass 0.012 [0.009, 0.015]) and QBA-corrected measures (%Trees: 0.010 [0.007, 0.013]; %Grass 0.012 [0.009, 0.015]).
Conclusion: Higher cumulative average trees and grass were associated with slower annual rate of cognitive decline. Our results were robust to QBA-corrected trees and grass measures.