Infectious Disease
West Nile virus cycle threshold values as supplementary data for human risk estimation: an exploratory investigation Ian Marchinton* Ian Marchinton Joseph Fauver
West Nile virus (WNV) is the most common mosquito-borne infection in the United States, with over a thousand human infections and neuroinvasive cases annually. Given infection risks, the CDC has helped establish robust WNV vector surveillance systems that produce metrics to assess human risk. This entails testing pools of vector species mosquitoes for the presence of WNV RNA to estimate infection rate through maximum likelihood. Cycle threshold (CT) values, produced from every WNV test conducted via reverse transcriptase quantitative polymerase chain reaction (RT-qPCR), are only used categorically for infection estimation despite being a quantitative metric. The current scope of risk analyses can be improved by incorporating these regularly-produced but unused quantitative data into estimations of risk. Our objective is to produce a scalable method for interpreting and utilizing CT values within United States WNV surveillance systems to better define when and where interventions are needed.
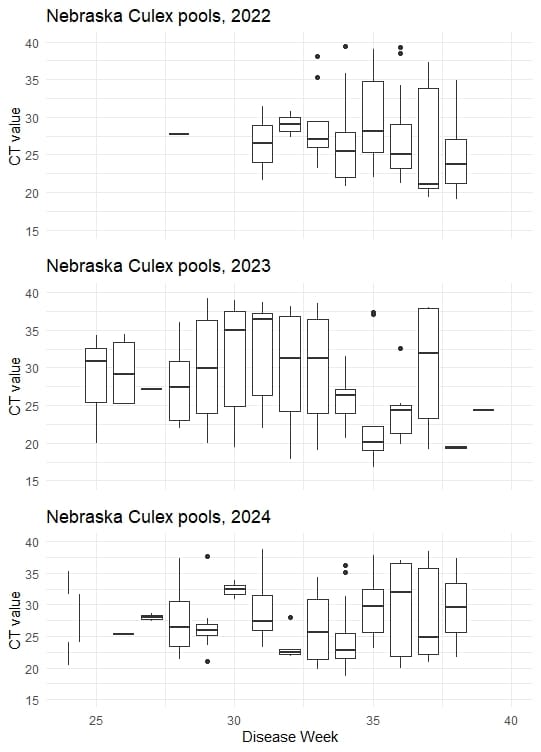
We generated a dataset using CT values and trap data from the high-incidence state of Nebraska during the 2022-2024 disease seasons to characterize inter- and intra-weekly variation in CT values across pools. We conducted a preliminary analysis of CT values via time-lagged Pearson correlation, GEE regression, and Poisson regression against state-level human case data to capture a statistical relationship. Based on data from Nebraska over the course of an annual disease season, there is unexplained variation in CT values. We did not detect a direct statistical relationship between CT values and human cases on a state-level, potentially due to heterogeneity by habitat makeup, dominant vector species, and localized effects like climate. We are working to statistically relate CT values to known risk metrics and human cases on a smaller, entomologically-relevant scale, as well as determine environmental factors that influence the variation in CT values we see in the attached figure.