Nutrition/Obesity
Are BMI-for-Age percentile curves a valid measure of obesity in older adults? Chris Kim* Christopher Kim Claire Cook Hailey Banack
Chris Kim, MPH, Claire Cook, MPH, Hailey Banack, PhD
Background: A body mass index (BMI) cutpoint of 30 kg/m2 is widely used to define obesity in clinical settings and epidemiologic research. However, its use is associated with poor validity, especially in postmenopausal women. The objective of the present work is to determine the validity of BMI-for-age percentile curves as a measure of obesity in older adults aged 45-86 years compared to an objective measure of obesity status, total body fat percent (BF%) measured by dual energy x-ray absorptiometry (DXA) scan.
Methods: Data from the Canadian Longitudinal Study on Aging (CLSA) baseline study visit were used. BMI was calculated from measured height and weight BF % was measured from whole-body DXA scan. Sensitivity (Se), specificity (Sp), positive predictive value (PPV), and negative predictive value (NPV) and their 95% confidence intervals were estimated for 1) BMI percentile vs. total BF % and 2) BMI category vs. total BF% using sampling weights. Empirical optimal BMI and BMI percentiles cutpoints were also computed for obesity defined based on BF% using Youden’s Index. Obesity was defined as BMI greater than the 85th percentile; BMI category >30 kg/m2; or using cutpoints of 35%, 38%, and 40% for BF%.
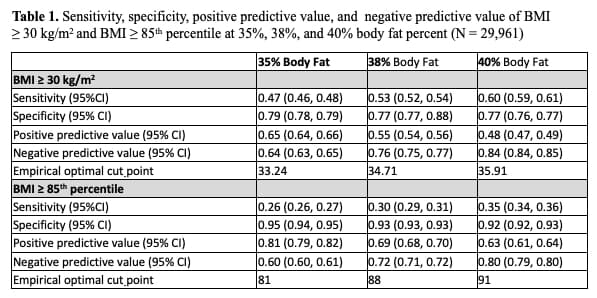
Results: Table 1 describes Se, Sp, PPV and NPV comparing a BMI cutpoint of 30 kg/m2 and BMI ≥85th percentile to a gold standard measure of DXA-defined BF% in 28,764 CLSA participants. Using a 40% BF cutpoint to define true obesity status, Se, Sp, PPV, and NPV for BMI ≥ 30 kg/m2 were 0.60 (0.59, 0.61), 0.77 (0.76, 0.77), 0.48 (0.47, 0.49), and 0.84 (0.84, 0.85). For BMI ≥ 85th percentile, Se, Sp, PPV, and NPV results were 0.35 (0.34, 0.36), 0.92 (0.92, 0.93), 0.63 (0.61, 0.64) and 0.80 (0.79, 0.80) at 40% BF%. Empirical optimal BMI cutpoints were 33.24, 34.71, and 35.91 for 35%, 38%, and 40% BF%, respectively. Empirical optimal BMI percentile cutpoints were 81, 88, and 91 for 35%, 38%, and 40% BF%, respectively.
Conclusions: Defining obesity using BMI-for-age percentile values (≥85th percentile) resulted in greater specificity and positive predictive value than the standard measure of obesity cutpoint of 30 kg/m2. However, this comes at a cost of reduced specificity. BMI-for-age percentiles are a valid measure of obesity status among older adults that accounts for age-related change.