Perinatal & Pediatric
Comparison of the NICHD Fetal Growth Charts to Individualized Growth Assessment Elizabeth Williams* Elizabeth Williams Maddy St. Ville Zhen Chen Jessica Gleason Dian He John Owen Roger Newman Edward Chien William Grobman Daniel Skupski Angela Ranzini Anthony Sciscione Jagteshwar Grewal Cuilin Zhang Fasil Tekola-Ayele Katherine Grantz
Abnormal fetal growth is associated with increased morbidity, yet no universal standard exists for identifying and classifying abnormal growth in practice. Specifically, distinguishing between pathologic fetal growth restriction (FGR) and benign constitutional smallness remains challenging. Individualized growth assessment (IGA) evaluates adequacy of fetal growth using each fetus as its own control and has been proposed as superior to standard population-based growth charts.
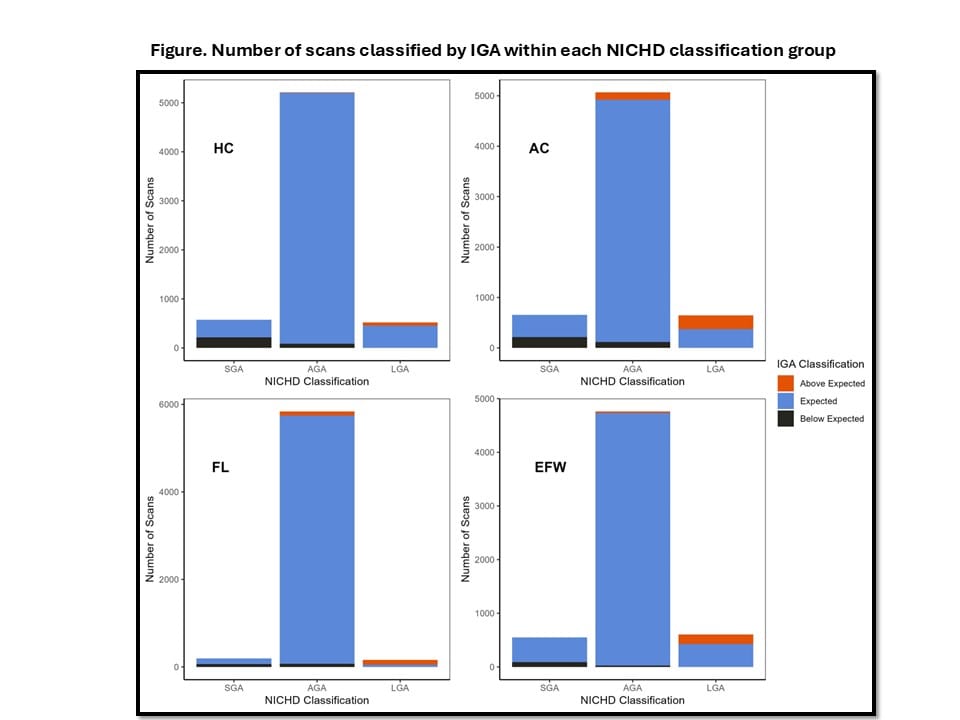
We compared these two methods using longitudinal ultrasound data in the NICHD Fetal Growth Studies-Singletons (N=2,447). For IGA, a set of 2nd trimester fetal measurements are used to fit a Rossavik growth model that predicts individual 3rd trimester (3T) growth potential within an expected range. We classified observed 3T fetal head circumference (HC), abdominal circumference (AC), femur length (FL), and estimated fetal weight (EFW) at each 3T visit as below, within, or above predicted ranges. We compared IGA classifications to small (SGA), appropriate (AGA), or large for gestational age (LGA) as <10th, 10-90th, or >90th percentile for GA, respectively, by NICHD charts by calculating percent concordance and performing Chi Square tests.
We found high concordance (94.9 to 98.9%) between IGA and the NICHD growth standard for fetuses classified as AGA according to the NICHD growth standard. However, IGA classified fewer fetuses at the extremes of growth compared to the NICHD growth standard (e.g., 2.0% and 3.4% were classified as EFW below and above expected by IGA, compared to 9.3% and 10.2% by NICHD, respectively; Figure).
If population-based SGA is a mix of benign and pathologically small fetuses, then it may be that those classified as below expected by IGA are pathologically small (2%), and those classified as SGA by the NICHD charts only as constitutionally small (7.3%). Future work is needed as better classification can improve resource utilization for at-risk pregnancies.