Infectious Disease
A Bayesian statistical model for forecasting probabilistic epidemic bands for dengue cases Laís Picinini Freitas* Laís Picinini Freitas Danielle Andreza da Cruz Ferreira Raquel Martins Lana Ayrton Sena Gouveia Iasmim Ferreira de Almeida Marilia Sá Carvalho Flávio Codeço Coelho Oswaldo Gonçalves Cruz Cláudia Torres Codeço Leonardo Soares Bastos
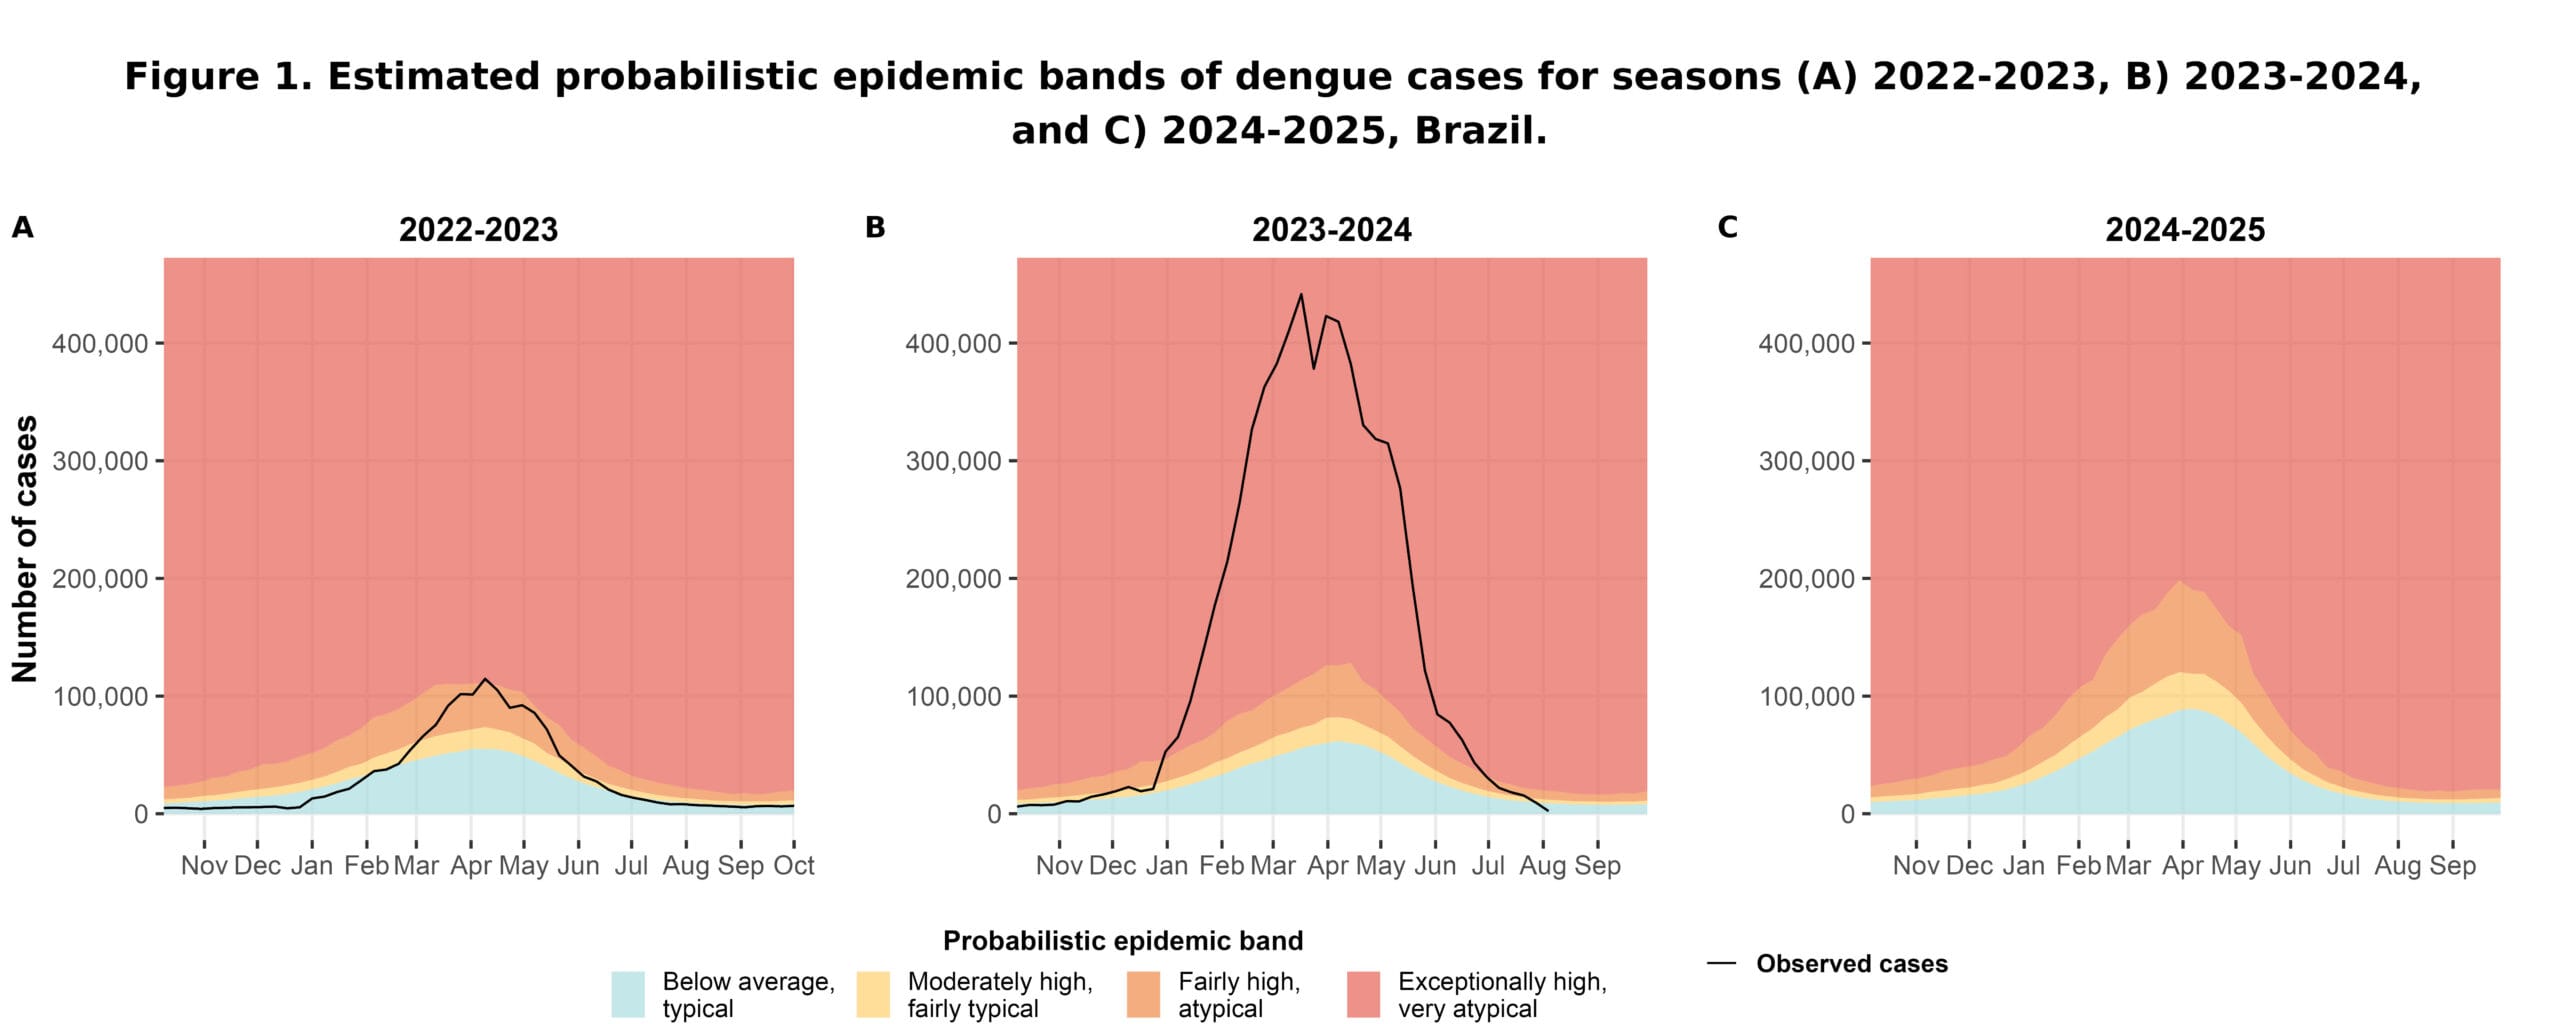
Dengue is a vector-borne disease and a major public health concern in Brazil, with on average 1 million cases annually. Using dengue case counts from the national surveillance system (2015-2024), organized by the Dengue Forecast Sprint initiative by InfoDengue-Mosqlimate, we propose a Bayesian negative binomial mixed model to forecast the number of cases 52 weeks ahead for the 118 health districts of Brazil. Health district-varying random effects structured for the week and unstructured for the season year (from epidemiological week 41 to 40) are included. Predictions are obtained from approximating the posterior predictive per week and health district. Percentiles of the distribution of predicted cases are used to get four disjoint probabilistic bands (≤50%, (50%,75%], (75%,90%], and ≥90%) that we name considering the historical number of cases and past occurrence probability (below average, typical; moderately high, fairly typical; fairly high, atypical; exceptionally high, very atypical). We performed out-of-sample validation for 2022-2023 and 2023-2024 and forecasted 2024-2025. In the 2022-2023 and 2023-2024 seasons, the epidemic bands followed the observed cases’ curve shape, with a sharp increase after January and a decline after the peak around April (Figure 1A and B). In 2022-2023, the observed cases curve fell within the “below average, typical” band in most weeks, increasing towards “moderately high, fairly typical” and “fairly high, atypical” bands until peaking. In 2023-2024, the observed number of cases was most of the time “exceptionally high, very atypical”. This season had an unprecedented record of 6.6 million dengue cases. For the 2024-2025 season (Figure 1C), the bands’ upper limits increased, influenced by the 2023-2024 data inclusion in the model. The probabilistic epidemic bands can be used for epidemic monitoring by comparing them prospectively with the observed cases curve to assess how an ongoing epidemic compares with past ones.