Health Disparities
Racial disparities in high grade uterine cancer: Socioeconomic status does not bridge the gap Sandra Tilmon* Sandra Tilmon Gabrielle Sudilovsky Yan Che Gini Fleming Diane Yamada Sarah Ackroyd
Uterine cancer incidence and mortality have been increasing in the U.S. largely due to a rise in high grade subtypes such as serous carcinoma and carcinosarcoma; these have worse morbidity and mortality than low grade subtypes such as endometrioid. Uterine cancer has one of the largest 5-year non-Hispanic (NH) Black to NH White survival disparities of all cancers. We aimed to understand what factors promote race/ethnicity disparities in high grade uterine cancer and hypothesize that social determinants of health, as measured by the social vulnerability metric (SVM), would at least partly account for this disparity (quartile 1: most vulnerable, quartile 4: least vulnerable).
A multivariate Cox Proportional Hazards Model (Cox PH) was performed and the proportional hazards assumption was tested; any variables in violation were modeled as time-varying.
Of 1,350 patients from the University of Chicago tumor registry, 479 had high grade cancer (carcinosarcoma n=184, serous n=295), while 907 patients had low grade/endometrioid. For survival including all subtypes (referent: endometrioid), Cox PH concordance was good at 0.77. Increased survival hazards were found for age (HR 1.04, 95% CI 1.02-1.06), carcinosarcoma (1.34, 1.04-1.73), serous (2.21, 1.67-2.91), stage at diagnosis (1.35, 1.24-1.47), Medicaid insurance (1.78, 1.07-2.93), and ever using tobacco (1.39, 1.08-1.77). Ever using alcohol was protective (0.74, 0.57-0.96). Non-Hispanic Black race and all SVM quartiles were insignificant.
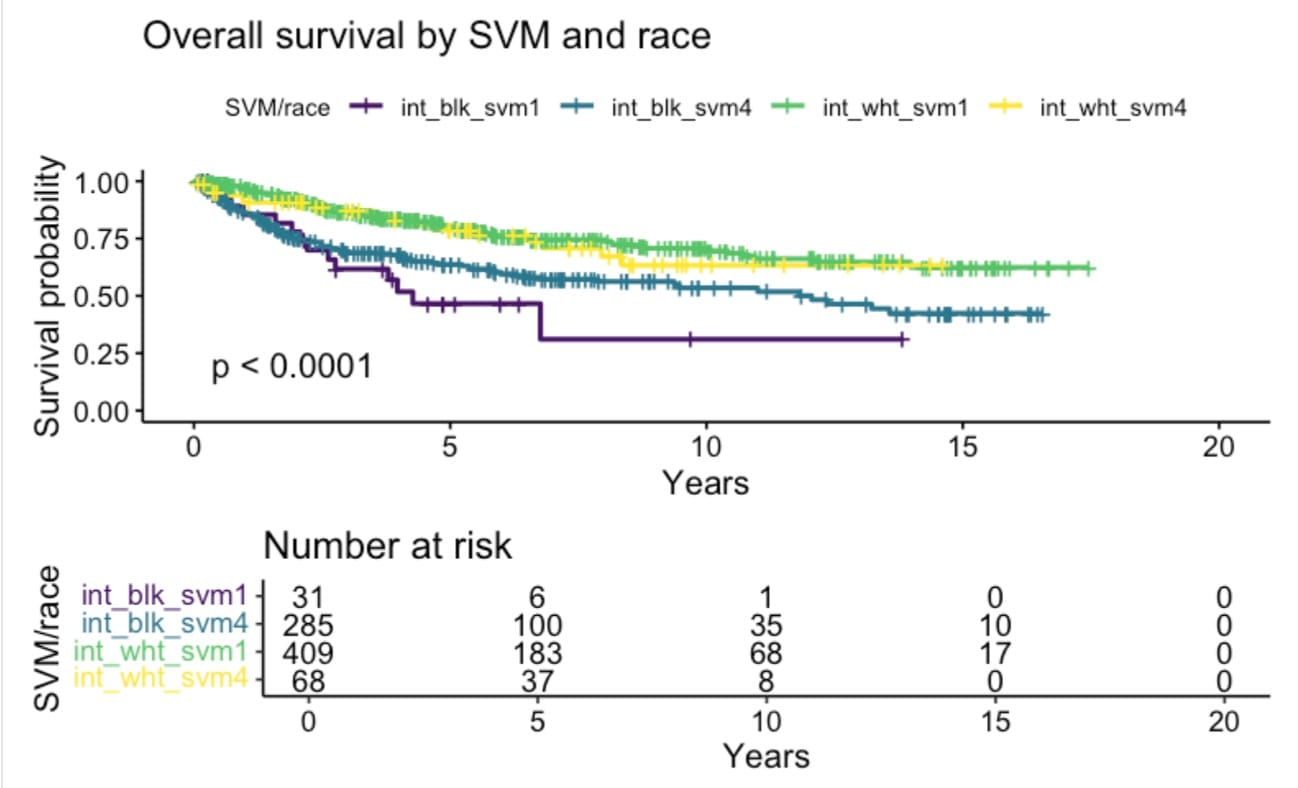
Interactions were explored with Kaplan Meier curves. NH race and SVM quartile 1 and quartile 4 interactions had significantly different survival (p<.0001). For all SVM quartiles, NH Black women had lower survival than NH White women. Within each NH race, the least vulnerable had improved survival over the most vulnerable.
Future steps include adding BMI, more modeling of interaction terms, as well as spatially-based social determinants of health analysis.