Environment/Climate Change
Street-View Green Space Distribution across Racial/Ethnic, Neighborhood Socioeconomic Status and Individual Education Sub-groups in the Multi-Ethnic Study of Atherosclerosis Tara Jenson* Tara Jenson Pi-I Debby Lin Peter James Perry Hystad Ana V. Diez-Roux Brent Coull Lilah Besser Esra Suel Jennifer Weuve Marcia Pescador Jimenez
Background Green space exposure is associated with health benefits via physical activity opportunity and reducing air and noise pollution exposure. Black, Hispanic, and low-income communities are overall exposed to less green space. It is unclear if green space exposure disparities are more pronounced for combinations of race/ethnicity and socioeconomic subgroups.
Methods Applying deep learning to street-view images, we calculated tree percentage in residential green space (%Trees) for Multi-Ethnic Study of Atherosclerosis participants (N=5858; 2000-2002). We used Multilevel Analysis of Individual Heterogeneity and Discriminatory Accuracy to quantify %Trees disparities by clustering individuals into 36 intersecting strata of race/ethnicity (Black, Chinese American, Hispanic, White), education (high school, some college, bachelor’s degree), and neighborhood socioeconomic status (NSES; low, moderate, high). Models adjusted for age, sex, individual income, and study site.
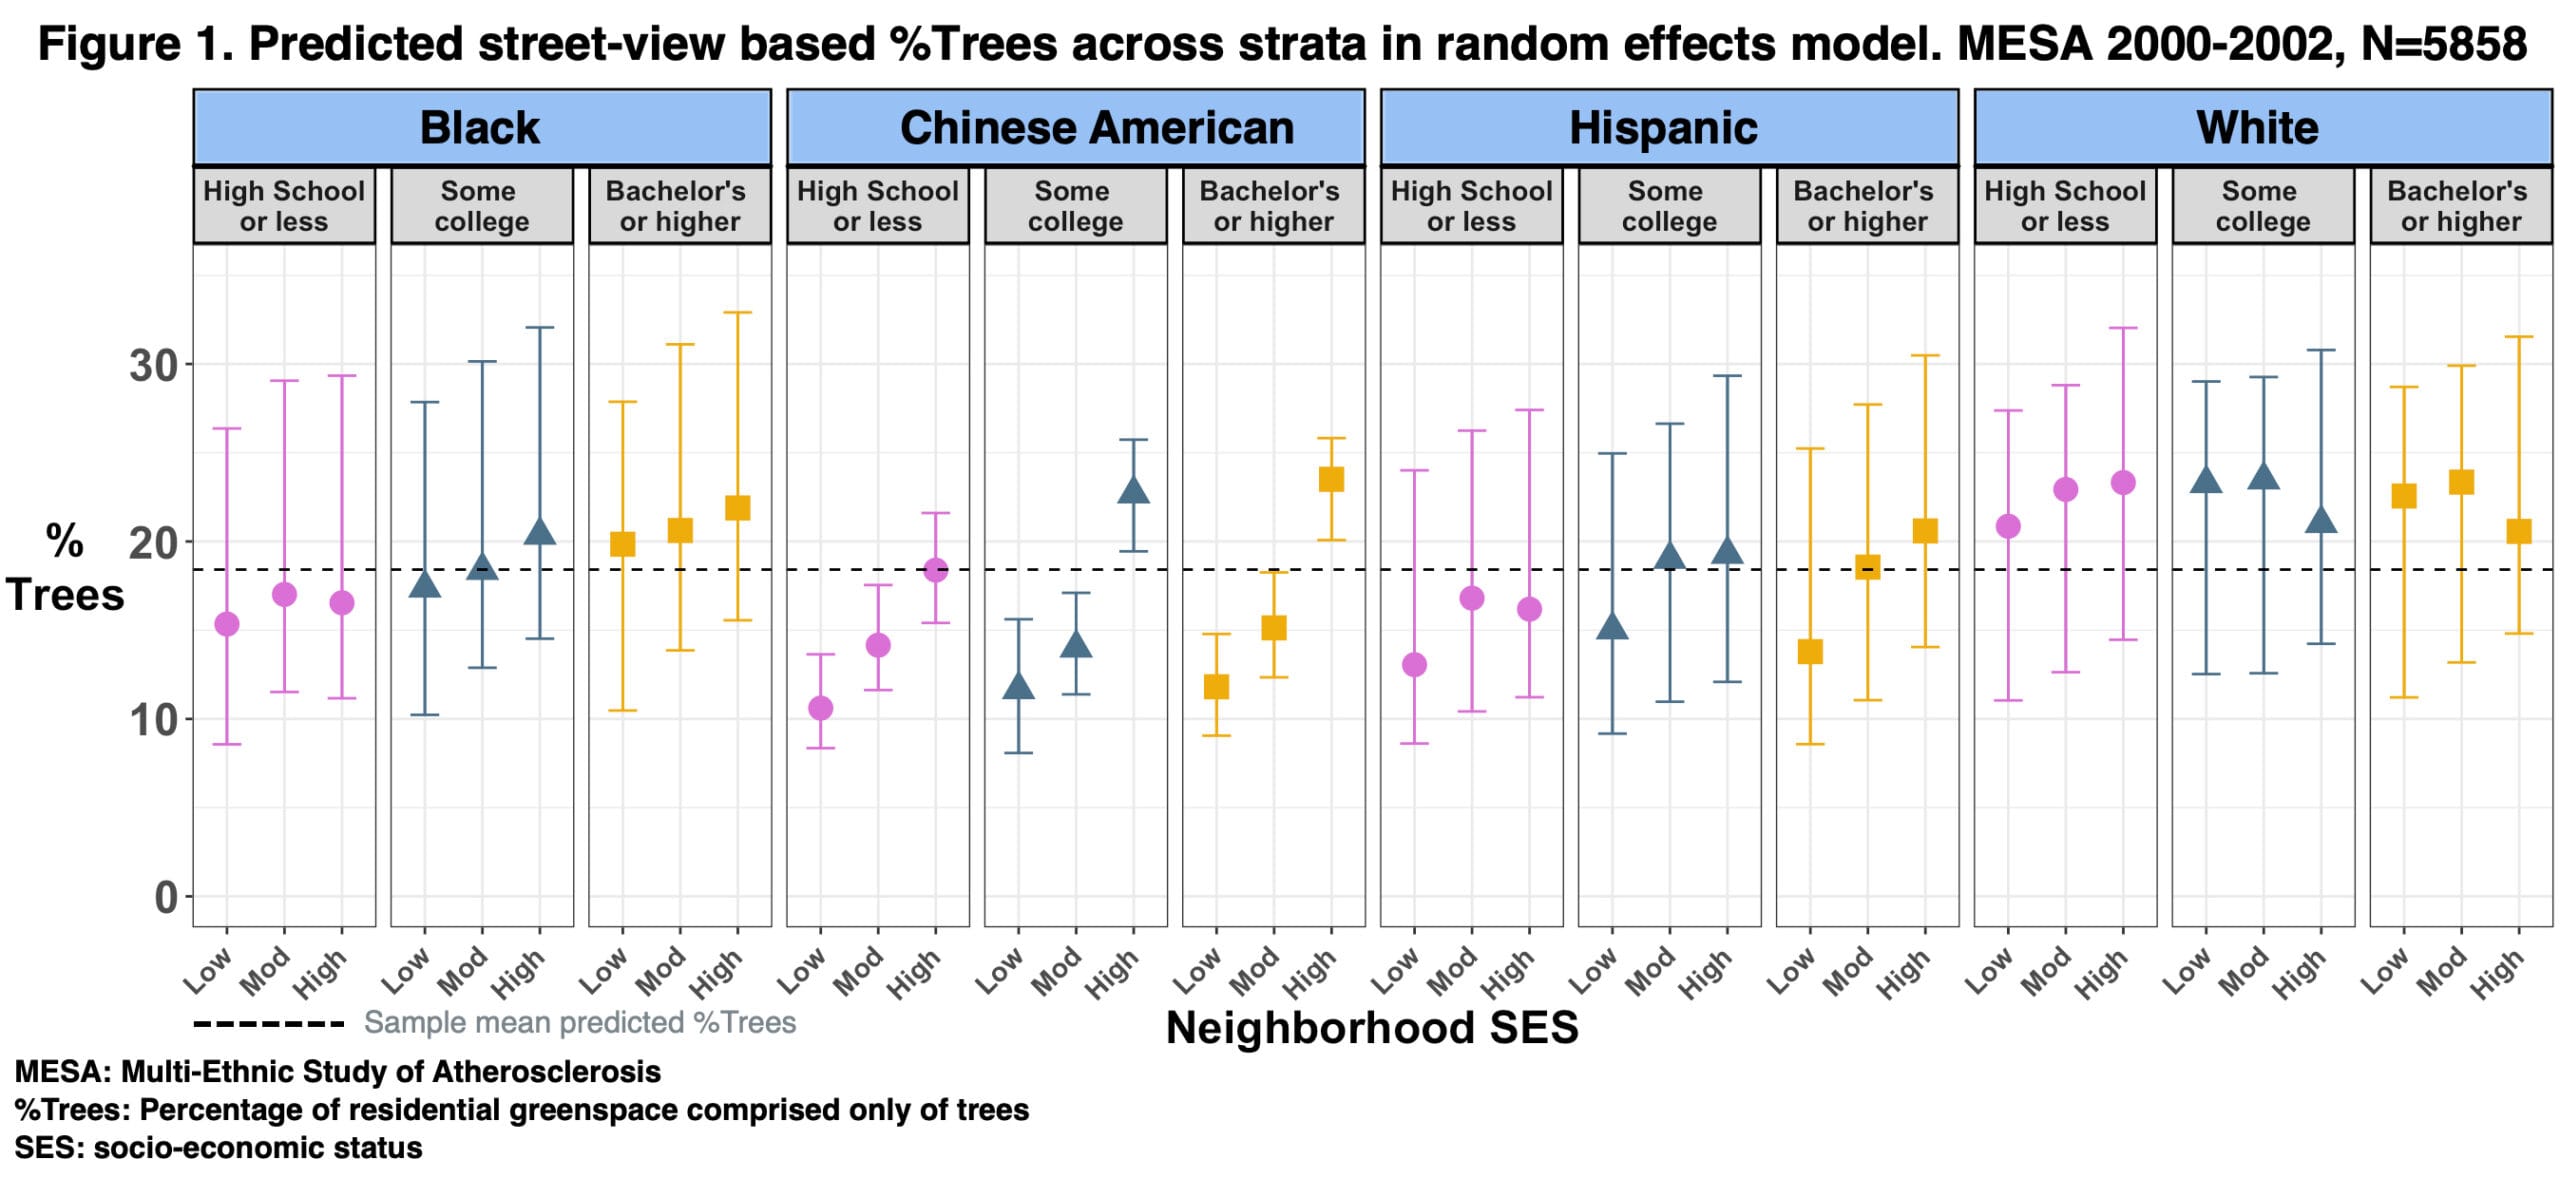
Results Our overall sample (26% Black, 12% Chinese American, 22% Hispanic, and 40% White) had a mean %Trees of 19.0 (SD 8.8). The variance partition coefficient showed that %Trees differed across intersecting identity strata, accounting for 16% of total variance. In the random effects model (Figure 1), among Hispanic participants, %Trees was 13.1 for those with lowest education and NSES (95% CI 9.1, 23.8) versus 20.5 for those with highest education and NSES (95% CI 14.0, 30.4). Similar trends were found for Black and Chinese American participants. However, the lowest %Trees for Whites was observed for the highest NSES and education stratum (20.6, 95% CI 14.8, 31.5).
Conclusion Higher education and NSES strata were associated with higher tree percentage for non-White race/ethnicity groups, but this trend was reversed for Whites. Intersectional identities defined by educational attainment, NSES, and race/ethnicity contributed substantially to the observed variance in residential tree percentage.